文章插图
# 选择小数据集、小颜色集
DSe2 <- DSe[2:3,]
C2 <- C[2:3]
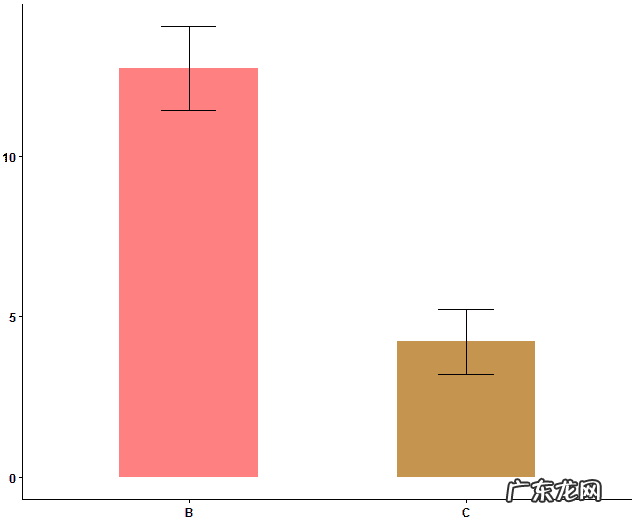
# 画小图,基本和大图一样,后面要背景透明、显示坐标轴
p2 <- ggplot(DSe2,aes(Group,Value)) +
geom_bar(aes(Group,Value,fill = Group), stat = \'identity\',width = 0.5) +
geom_errorbar(aes(ymin = Value-se, ymax = Value+se),width = .2)+
scale_fill_manual(values = C2)+
guides(fill = F)+
theme(axis.text = element_text(face = \'bold\',colour = \'black\'),
axis.title.y = element_blank,
axis.line = element_line(linetype = 1,colour = \'black\'), # 显示坐标轴
plot.background = element_rect(I(0),linetype = 0), # 背景透明
panel.background = element_rect(I(0)),
panel.grid.major = element_line(colour = NA),
panel.grid.minor = element_line(colour = NA))
p2
# 选择小数据集、小颜色集
DSe2 <- DSe[2:3,]
C2 <- C[2:3]
# 画小图,基本和大图一样,后面要背景透明、显示坐标轴
p2 <- ggplot(DSe2,aes(Group,Value)) +
geom_bar(aes(Group,Value,fill = Group), stat = \'identity\',width = 0.5) +
geom_errorbar(aes(ymin = Value-se, ymax = Value+se),width = .2)+
scale_fill_manual(values = C2)+
guides(fill = F)+
theme(axis.text = element_text(face = \'bold\',colour = \'black\'),
axis.title.y = element_blank,
axis.line = element_line(linetype = 1,colour = \'black\'), # 显示坐标轴
plot.background = element_rect(I(0),linetype = 0), # 背景透明
panel.background = element_rect(I(0)),
panel.grid.major = element_line(colour = NA),
panel.grid.minor = element_line(colour = NA))
p2
文章插图
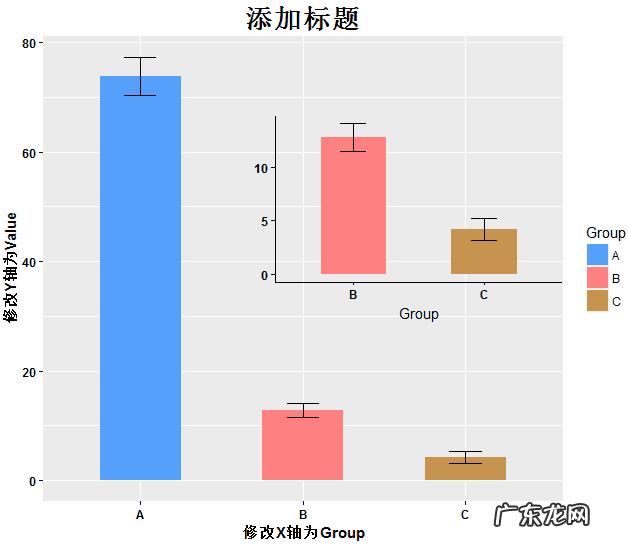
# 嵌套
sub <- viewport(width = 0.5,height = 0.4,x = 0.64,y = 0.6) # 配置环境 。前两个是子图的大小比例,后两个是位置,可自行调整到好看为止 。
p1 # 上大图
print(p2,vp = sub) # 加小图
# 嵌套
sub <- viewport(width = 0.5,height = 0.4,x = 0.64,y = 0.6) # 配置环境 。前两个是子图的大小比例,后两个是位置,可自行调整到好看为止 。
p1 # 上大图
print(p2,vp = sub) # 加小图
文章插图
就酱 。如果你真的想做截断坐标轴的图,听说plotrix包可以,详见参考资料3 。
参考资料:
1. https://groups.google.com/forum/#!topic/ggplot2/jSrL_FnS8kc
2. https://stats.stackexchange.com/questions/1764/what-are-alternatives-to-broken-axes
3. https://stackoverflow.com/questions/19612348/break-x-axis-in-r
tougao@helixlife.com.cn
- 风水出官职大小看哪里 什么样的风水能出大官
- 2023特别温柔的个性签名 越看越惊艳的签名
- 想象和现实总有差距作文 想象和现实总有差距
- 风水上如何找房子中心点 如何看宅子风水
- 淘宝权限怎么查看 淘宝权限记录在哪里看
- 风水宝地图片 白马风水宝地图片
- 看风水合法那 看风水违法吗
- 倒插门怎么样 怎么看待倒插门
- 对风水的看法 看风水都问些什么问题
- 推荐量与阅读量 没有推荐量和阅读量
特别声明:本站内容均来自网友提供或互联网,仅供参考,请勿用于商业和其他非法用途。如果侵犯了您的权益请与我们联系,我们将在24小时内删除。